Cross section preparation and microstructure characterization in respect to chemical composition, phase fraction and arrangement as well as grain size and orientation analyses are in the main focus of the competence group metallography.
The knowledge of the chemical composition is important in many respects for the research on the chemical, structural and physical properties of a single phase. These chemical analyses are realized by means of electron microprobe techniques which allow accurate analyses on diverse objects from small single crystals suitable for X-ray diffraction experiments up to multiphase materials in phase diagram studies. Special activities of our competence group are related to light element quantification and microstructure analyses on water/air sensitive materials.


Cross section preparation / Light optical microscopy
The equipment for sampling, embedding and preparation of metallographic microstructures is mainly suitable and optimized for the handling of metals and metallic alloys. Additionally, a complete preparation line of modified equipment is arranged in a glove-box under Argon atmosphere. It allows metallographic investigations of air and water sensitive samples like rare earth metal rich alloys but also some intermetallic silicides, arsenides and stanides are highly air-sensitive and need to be handled completely under inert conditions.
All microstructures are characterized by light optical microscopy in bright field, polarized light and differential interference contrast (DIC). Bright field images are based on the optical reflectivity and give first indications on the number of phases and their arrangement. Polarized light contrast depends on the orientation of the investigated grains and is suitable to estimate grain size distribution or textures at least for most non cubic phases e.g. phases with anisotropic optical reflectivity. Especially, twinning is easy to detect in polarized light contrast. This means, that polymorphic phase transformations often accompanied by twinning due to the symmetry reduction from the high temperature to the low temperature modification leave a fingerprint in the microstructure. Also, magnetic domains are visible in polarised light contrast in specific cases. DIC visualize the surface topography and is very sensitive to surface roughness on nanometre scale. It is an important tool to evaluate the surface quality which has to fulfil high demands in case of quantifications by electron microprobe analysis.
In selected cases, chemical etching or Argon-ion beam etching are applied to develop microstructure features. The aim is often the enhancement of the optical contrast between different phases or grains or to visualize grain boundaries.
It is important to state that reliable analyses and evaluations of the microstructure require well prepared cross sections which are realized in our lab by semi-automatic, mechanical preparation process consisting of a multi-step sequence of grinding and polishing. Polarisation contrast and surface sensitive investigations in the scanning electron microscope necessitate often to adapt the standard preparation route to the concrete material and its mechanical properties.


Sampling:
Precision cut-off machine 300 – 5000 U/min (Accutom 50, Struers)
Wire-saw (WS22, K.D.Unipress) and diamond wire-saw in inert atmosphere (Well)
Mounting:
hot mounting press (ProntoPress 10)
equipment for cold mounting and vacuum impregnation
cold mounting, conductive resins containing Ag, Ni, Cu or graphite for SEM applications
Grinding and Polishing:
semi-automatic grinding and polishing machines with specimen movers and dosing system (RotoPol 15, Struers, EcoMet 250 pro, Buehler)
Precision lapping and polishing machine (PM5, Logitech)
Ion-beam etching apparatus (Met-Etch, Gatan)
Preparation of air- and water-sensitive samples:
Ethanol-based lubricants and suspensions with abrasives are used for the metallographic preparation of less reactive samples.
Highly sensitive materials are handled in a glove -box under inert argon atmosphere. These samples are cold mounted in silver containing epoxy resin which is suitable for SEM and microprobe applications. Areas up to 1 cm² can be prepared either without lubricants or with oil- or hexane-based liquids. SiC-papers and diamond powder with 3 µm or smaller grain size are used as abrasive materials.
Light-optical Microsopy
invers microscopes for brightfield, darkfield and polarised light contrast (Axiovert, Zeiss)
Material microscope for reflected and transmitted light applications with brightfild, darkfield, polarised light and differential interference contrast (Axioplan 2, Zeiss)
Laser-Scanning-Microscope
Vickers micro hardness tester (0.005 N - 4 N)
Hot stage for light optical microscopy (-100°C < T < 1500°C).
Digitale Imaging
Determination of phase contents and grain size distributions using digital image processing software (AnalySIS five, Olympus)
Density determination
Helium gas-pycnometer for the determination of the macroscopic density of bulk or powdered samples (max. volume 1cm³ , AccuPyc 1330, Micromeritics),
Electron microprobe and Scanning electron microscopy
Both electron microscopes of the competence group metallography – electron microprobe Cameca SX100 and SEM Philips XL30 (FEI) – are mainly used for elemental analysis on metallographic cross-sections but also the electron imaging qualities of these microscopes are used to document morphologies of small singles crystals prepared for example by chemical transport or to characterize processed powders.
The outstanding advantage of the analytical possibilities of a scanning electron microscope is the quit accurate element quantification combined with very good spatial resolution. It allows the quantification of phase composition in multiphase samples which is most valuable for the determination of phase equilibria in phase diagram studies and for the detection of impurity phases far below the detection limits of many other analytical methods. The actual method is based on the intensity measurement of element X-ray lines created by the bombardment of the cross section by the focused electron beam in the microscope. In fact, the average composition of a volume of several µm³ depending on the acceleration voltage and density of the material is determined. The proportionality between the intensity of the K, L, or M X-ray lines of the elements and their weight concentration is the fundamental relation for this analytical method. This relation is slightly surprising because it might be expected to be related to the atomic concentration of an element. In fact, the number of ionised atoms e.g. atoms contributing to the creation of X-ray radiation depends from the penetrated volume which is not constant for different element concentration. In first approximation the penetration depth depends from the material density which leads to the given intensity to weight concentration relation. Differences between created and detected intensities occur due to absorption and fluorescence processes in the analysed volume. These inter-element effects are considered in matrix correction calculations. The quantitative procedures of comparing the intensities of an unknown concentration and a well-defined reference material can reach relative accuracies of 2% when the samples are in the ideal form of a metallographically polished bulk solid. Most challenging is the quantification of light elements like B, C, N or O due to the small energies (< 1 keV) of their K lines. Substantial matrix correction mainly due to strong absorption has to be considered and surface quality significantly influences the quantitative results. Additionally, (partial) coincidence with X-ray lines of matrix elements and chemical shift often force to apply adjusted procedures for the intensity measurements.
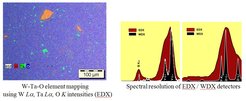
Two different kinds of detectors are used for this analytical application of the scanning electron microscopes. Both microscopes – Cameca SX100 and Philips XL30 – are equipped with energy dispersive X-ray spectroscopy (EDXS) systems which measure the X-rays of all energies simultaneously by silicon detectors. Spectral resolution and counting rates are significantly improved in actual silicon drift detectors (SDD) compared to former lithium drifted silicon detectors by the modified design and faster processing of the electrical signal which is caused by the energy of the X-ray quanta deposited in the silicon detector.
The alternative method of the wave-length dispersive X-ray spectroscopy (WDXS) uses gas proportional counters to measure the intensity of a single X-ray line which is selected by a crystal monochromator adjusted according the Bragg diffraction condition and the related wavelength of the X-ray line. Four WDX spectrometers are installed on our electron microprobe Cameca SX100 and 8 crystal monochromators cover the spectral range from 60 eV up to 12 keV. The WDXS method reveals a much better spectral resolution and signal to background ratio compared to the EDXS. It has significant advantages for light element analyses and also trace element quantification. In many cases, quantification is more accurate and precise compared to EDXS results. On the other hand much higher beam currents up to 100 nA may be necessary and the sequential detection of the X-ray lines is time consuming and restricts the applications of the WDXS method.
Applications for the EDXS arising from the very high rates of processed counts and the simultaneous recording of the complete X-ray spectrum. This allows element mappings on larger areas, line scans and multi point analyses within manageable periods of time. Additionally, the possibility of semi-quantitative analysis using predefined reference spectra from a database simplifies the experimental work significantly. Thus, EDXS is the most frequently used method for qualitative and quantitative analyses.

Scanning Electron Microscopy
- SEM Philips XL30 with LaB6-cathode
- acceleration voltage : 1 kV - 30 kV
- Detectors:
back scattered electron detector
secondary electron detector (Everhardt-Thornley),
STEM – detector
Silicon drift detector for energy dispersive X-ray spectroscopy (EDXS) - shuttle transfer system for air-sensitive samples
The integrated EDXS-system (Quantax, Bruker) allows to detect Boron and elements with higher atomic number Z (Z >4). The EDXS analyses are usually performed in a semi-quantitative way without standards. Calculation of the chemical composition uses matrices correction models ZAF, φ(ρz) and P/B ZAF, implemented in the software package Esprit (Vers.1.9.4.; Bruker). It is recommended to use standard based quantification method for elements Z < 11 (Na).
Electron microprobe
- Cameca SX 100 microprobe with tungsten cathode
- acceleration voltage: 1 kV - 30 kV
- suttle transfer system for air sensitive samples
- anti-contamination system
- Detectors:
back-scattered electron detector,
secondary electron detector (Everhardt-Thornley),
Si-(Li)-detector for determination of energy dispersive x-ray spectra (EDXS)
Four WDX spectrometers with analysator crystals und Ar/Methan proportional counters - crystals of the wavelength dispersive X-ray spectrometers:
|
crystal |
formula |
lattice- |
X-Ray line |
|
|
LIF |
Lithium fluorid (LiF) |
4.03 |
Sc-Rb |
Te-U |
|
PET |
Pentaerythritol (C5H12O4) |
8.74 |
Si-Mn |
Sr-Tb |
|
TAP |
Thallium acid phthalate (C8H5O4Tl) |
27.7 |
F-P |
Mn-Nb |
|
PC1 |
W/Si Multilayer |
60 |
C-F |
|
|
PC2 |
Ni/C Multilayer |
95 |
B-O |
|
|
PC3 |
Mo/B4C Multilayer |
200 |
Be-B |
|
Matrix correction models PAP [1] or X-φ [2] are applied. Both are implemented in the Cameca software package (PeakSight Vers. 5.21). Here, mass absorption coefficients according to tables by K.F.J. Heinrich (mac86, [3]) and B.L.Heneke [4] are used.
[1] J.L. Pouchou, and F. Pichoir, (1984) Rech.Aerosp. 3, 13-38.
[2] C. Merlet; Microchim. Acta (1992) [Suppl.] 12: 107-115.
[3] K. F. J. Heinrich (mac86) Proc. 11th IXCOM, 1987, page 67.
[4] B. L. Henke, P. Lee, T. J. Tanaka, R. L. Shimabukuro and B. K. Fijikawa, Atomic Data Nucl. Data Tables 27, 1 (1982).